
Page 33 - Ghost Digital
P. 33
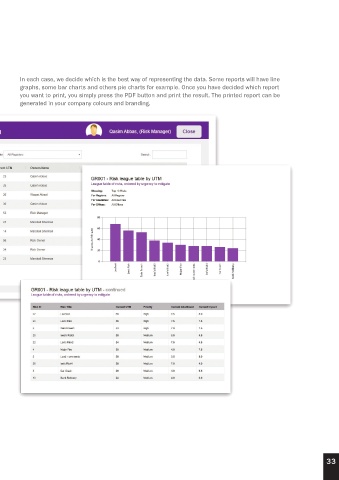
In each case, we decide which is the best way of representing the data. Some reports will have line
        graphs, some bar charts and others pie charts for example. Once you have decided which report
        you want to print, you simply press the PDF button and print the result. The printed report can be
        generated in your company colours and branding.


                                                                                                                    33