
Page 28 - Ghost Digital
P. 28
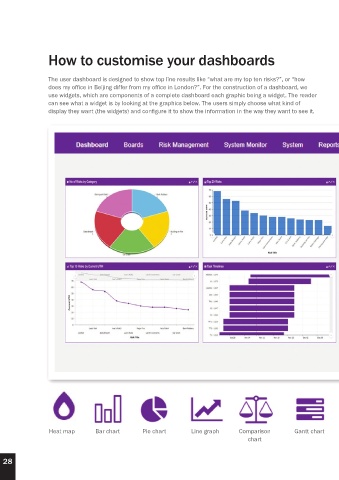
How to customise your dashboards


                  The user dashboard is designed to show top line results like “what are my top ten risks?”, or “how
                  does my office in Beijing differ from my office in London?”. For the construction of a dashboard, we
                  use widgets, which are components of a complete dashboard each graphic being a widget. The reader
                  can see what a widget is by looking at the graphics below. The users simply choose what kind of
                  display they want (the widgets) and configure it to show the information in the way they want to see it.


                  Heat map         Bar chart       Pie chart        Line graph       Comparison         Gantt chart
                                                                                        chart


  28