
Page 27 - Ghost Digital
P. 27
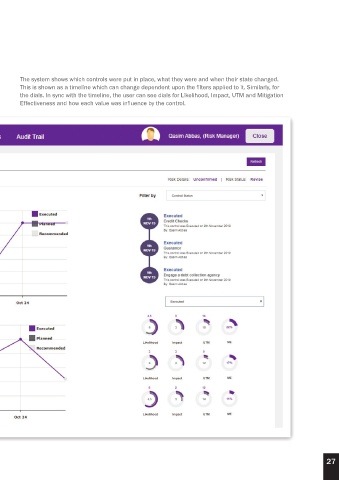
The system shows which controls were put in place, what they were and when their state changed.
        This is shown as a timeline which can change dependent upon the filters applied to it. Similarly, for
        the dials. In sync with the timeline, the user can see dials for Likelihood, Impact, UTM and Mitigation
        Effectiveness and how each value was influence by the control.


                                                                                                                    27